[LGTM] Alloy 與 Tempo、Loki 整合:以 Java 為例
1. LGTM 與 Alloy 簡介
Open Source 陣營中的 Grafana,針對了 Day 2 operation 裡頭的 log、trace 以及 metrics,分別推出了 Loki、Tempo 以及 Mimir 來做為後端儲存使用的 backend。順帶一提的是,這三個 solution 的架構極為相似,可單獨使用,也可以一起搭配使用,也都很容易就能橫向擴充,從小型到大型的架構都適合使用。前述三個 solution 統一使用 Grafana 做為資料呈現使用,這四個 solution 首字字母合起來縮寫為 LGTM。
除此之外,alloy 做為 agent,負責將收集到的 log、trace 以及 metrics,根據設定檔來處理資料,像是上 label、轉送到指定的地方
2. Lab 說明
這回會實際以一個 Java 的 application 來做為範例,進行以下的測試:
-
application 的 log 要如何透過 alloy 接進 loki
-
applicaiton 的 trace 如何直接寫至 tempo
-
application 的 trace 如何透過 alloy 再寫至 tempo
其中,Loki / Tempo / Alloy 以及測試用的 Java application,都會是部署在 K8S cluster 上
K8S 的版本為 1.28.12 搭配 containerd
3. 實作步驟
以下為安裝的步驟,只列出如何透過 helm 與 helm chart,將相關的 solution 部署至 K8S cluster 之上
3.1 安裝/設定 Loki
我先裝了 minio 讓 loki 可以把資料收到 minio 的 bucket 裡
loki 的 helm chart 裡,values.yaml 有寫到,deploymentMode 有分為三種:SingleBinary 、SimpleScalable 以及 Distributed
其中,
- SingleBinary 是以單獨的 binary 的方式來運作,有點像以前單體式的架構
- SimpleScalable 則是將架構大概地分為 read、write 以及 backend
- Distributed 則是把各服務以 microservices 部署至 K8S cluster 上,未來可以視需求針對不同的服務各別擴充
這裡當然就是以 Distributed 的模式來部署
helm repo add grafana https://grafana.github.io/helm-charts
helm pull grafana/loki --untar
cd loki
cat > values-loki.yaml << EOF
loki:
schemaConfig:
configs:
- from: 2024-04-01
store: tsdb
object_store: s3
schema: v13
index:
prefix: loki_index_
period: 24h
ingester:
chunk_encoding: snappy
tracing:
enabled: true
querier:
# Default is 4, if you have enough memory and CPU you can increase, reduce if OOMing
max_concurrent: 4
storage:
bucketNames:
chunks: chunks
ruler: ruler
admin: admin
type: s3
s3:
s3: null
endpoint: http://minio.minio:9000/loki
accessKeyId: loki_admin
secretAccessKey: loki_admin123
s3ForcePathStyle: true
insecure: true
auth_enabled: false
lokiCanary:
enabled: false
test:
enabled: false
deploymentMode: Distributed
ingester:
replicas: 1
querier:
replicas: 1
maxUnavailable: 2
queryFrontend:
replicas: 1
maxUnavailable: 1
queryScheduler:
replicas: 1
distributor:
replicas: 1
maxUnavailable: 2
compactor:
replicas: 1
indexGateway:
replicas: 1
maxUnavailable: 1
# optional experimental components
bloomPlanner:
replicas: 0
bloomBuilder:
replicas: 0
bloomGateway:
replicas: 0
# Enable minio for storage
minio:
enabled: false
# Zero out replica counts of other deployment modes
backend:
replicas: 0
read:
replicas: 0
write:
replicas: 0
singleBinary:
replicas: 0
EOF
sed -i 's/memory: {{ $requestMemory }}Mi/memory: 500Mi/g' templates/memcached/_memcached-statefulset.tpl
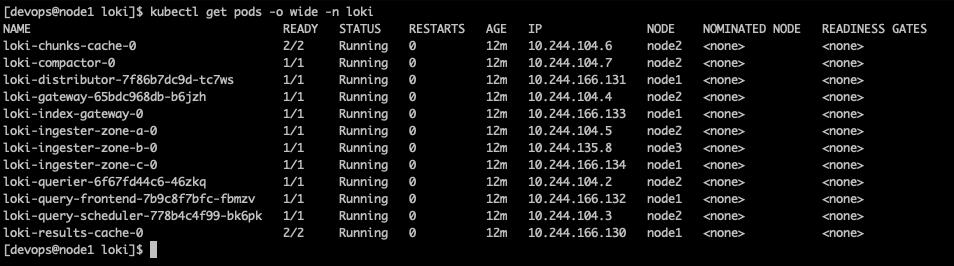
helm install -n loki --create-namespace loki . -f values-loki.yaml安裝後,來確認一下狀況,先來看 pod 的狀態
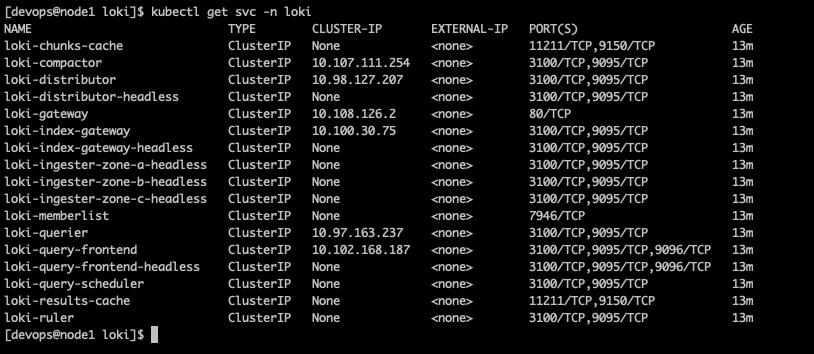
再來,看一下 service
3.2 安裝/設定 Grafana
接著一樣以 helm chart 的方式來安裝 grafana,安裝於 grafana 這個 namespace
helm repo add grafana https://grafana.github.io/helm-charts
helm pull grafana/grafana --untar
cd grafana
cat > values-grafana.yaml << EOF
ingress:
enabled: true
ingressClassName: nginx
path: "/grafana"
pathType: Prefix
hosts:
- "test.example.com"
grafana.ini:
server:
domain: test.example.com
root_url: "http://test.example.com:32080/grafana"
serve_from_sub_path: true
datasources:
datasources.yaml:
apiVersion: 1
datasources:
- name: Loki
type: loki
access: proxy
url: http://loki-gateway.loki
adminUser: admin
adminPassword: admin123
EOF
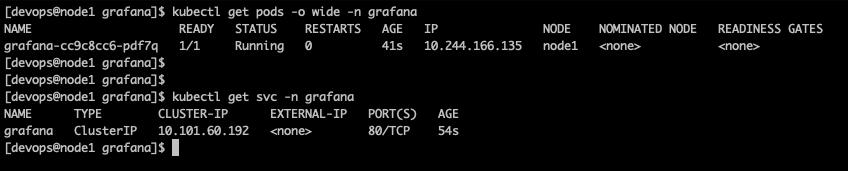
helm install -n grafana --create-namespace grafana . -f values-grafana.yamlgrafana 安裝好了之後,它的 pod 與 svc 比較簡單一些
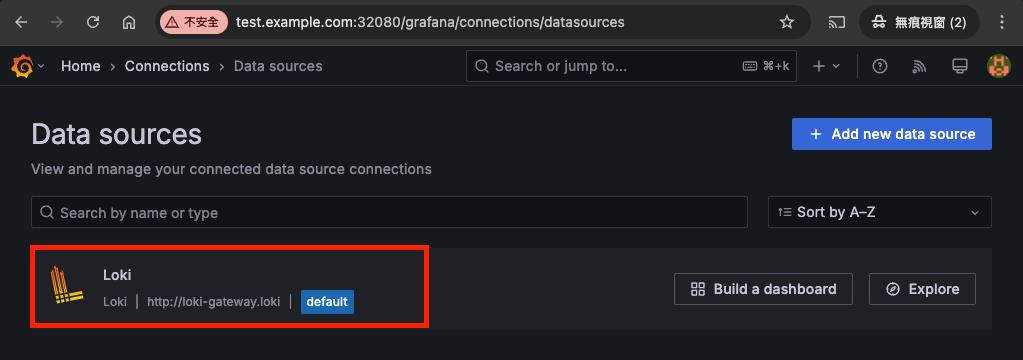
因為剛剛在 values-grafana.yaml 裡的 datasources 那一段已經事先寫好了一個 type 為 loki,名字則為 Loki 的 data source
登入 grafana 就會看到該 data source 了
3.3 安裝/設定 Tempo
繼續往下裝 tempo
helm repo add grafana https://grafana.github.io/helm-charts
helm pull grafana/tempo-distributed --untar
cd tempo-distributed
cat > values-tempo.yaml << EOF
global_overrides:
metrics_generator_processors:
- service-graphs
- span-metrics
metricsGenerator:
enabled: true
storage:
remote_write:
- url: "http://loki-stack-prometheus-server.monitoring/api/v1/write"
gateway:
enabled: true
traces:
otlp:
http:
enabled: true
grpc:
enabled: true
EOF
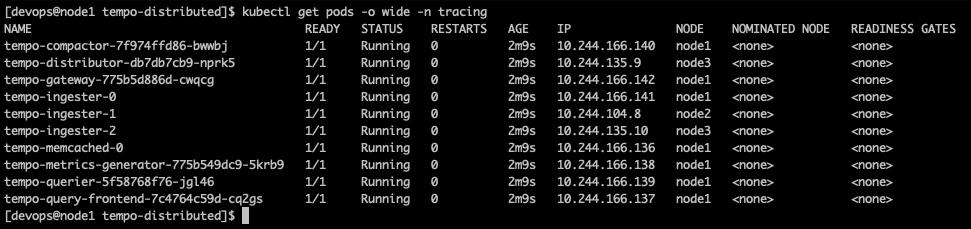
helm install -n tracing --create-namespace tempo . -f values-tempo.yaml因為這回要測試的是 OTLP,所以只 enable 了 http 以及 grpc 兩種
一樣,來看一下安裝後 pod 的狀態
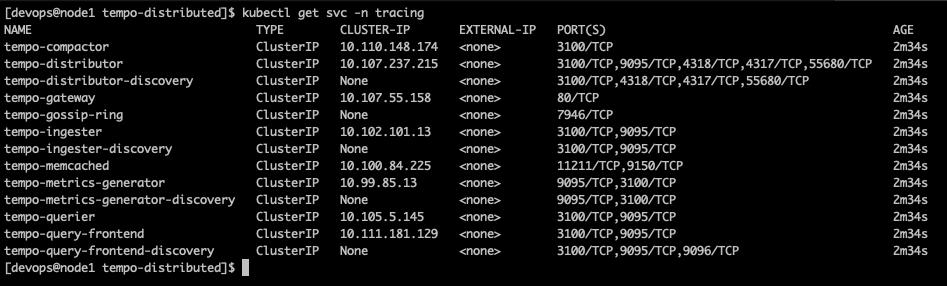
再來看 svc
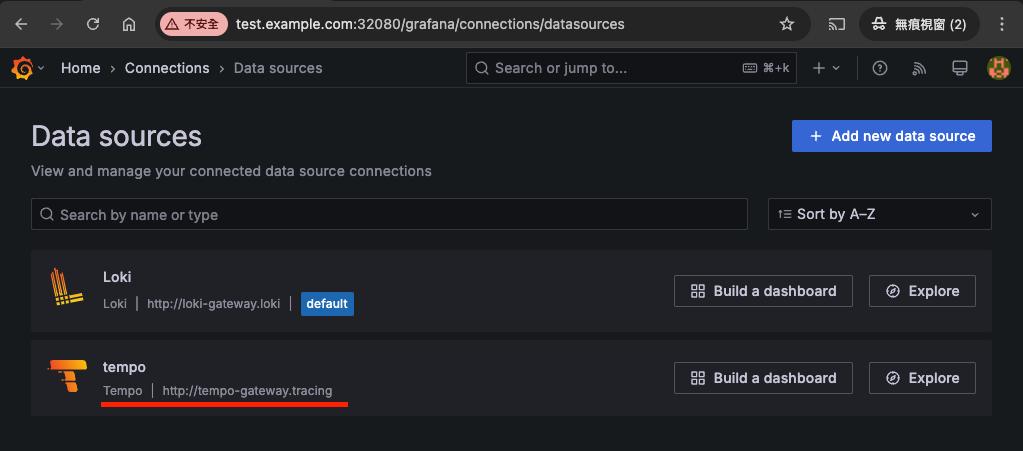
然後,用 web browser 連到 grafana,加入一個 type 為 tempo 的 data source,連到 http://tempo-gateway.tracing
3.4 安裝/設定 Alloy
接著,換來安裝 alloy
helm repo add grafana https://grafana.github.io/helm-charts
helm pull grafana/alloy --untar

cat > values-alloy-to-loki.yaml << EOF
alloy:
  mounts:
    varlog: true

  extraPorts:
    - name: "otlp-grpc"
      port: 4317
      targetPort: 4317
    - name: "otlp-http"
      port: 4318
      targetPort: 4318

  resources:
    limits:
      cpu: 10m
      memory: 100Mi
EOF

sed -i 's/example.alloy/config.alloy/g' ~/helm-charts/alloy/templates/configmap.yaml
alloy 都是根據設定檔來決定要做什麼事情,這裡直接把設定檔寫在 helm chart 裡頭的 config/config.alloy
configmap 預設則是去讀 config/example.alloy,所以最後是去修改了 templates/configmap.yaml 裡的內容
接著才是要來新增 config.alloy
logging {
  level = "debug"
  format = "logfmt"
}

loki.write "default" {
  endpoint {
    url = "http://loki-gateway.loki/loki/api/v1/push"
  }
}

// for k8s pod logs
discovery.kubernetes "pod" {
  role = "pod"
}

discovery.relabel "pod_logs" {
  targets = discovery.kubernetes.pod.targets

  rule {
    source_labels = ["__meta_kubernetes_namespace"]
    action = "replace"
    target_label = "namespace"
  }

  rule {
    source_labels = ["__meta_kubernetes_pod_node_name"]
    action = "replace"
    target_label = "node_name"
  }

  rule {
    source_labels = ["__meta_kubernetes_pod_name"]
    action = "replace"
    target_label = "pod"
  }

  rule {
    source_labels = ["__meta_kubernetes_pod_ip"]
    action = "replace"
    target_label = "pod_ip"
  }

  rule {
    source_labels = ["__meta_kubernetes_pod_container_name"]
    action = "replace"
    target_label = "container"
  }

  rule {
    source_labels = ["__meta_kubernetes_pod_label_app_kubernetes_io_name"]
    action = "replace"
    target_label = "app"
  }

  rule {
    source_labels = ["__meta_kubernetes_namespace", "__meta_kubernetes_pod_container_name"]
    action = "replace"
    target_label = "job"
    separator = "/"
    replacement ="$1"
  }

  rule {
    source_labels = ["__meta_kubernetes_pod_uid", "__meta_kubernetes_pod_container_name"]
    action = "replace"
    target_label = "__path__"
    separator = "/"
    replacement = "/var/log/pods/*$1/*.log"
  }

  rule {
    source_labels = ["__meta_kubernetes_pod_container_id"]
    action = "replace"
    target_label = "container_runtime"
    regex = "^(\\S+):\\/\\/.+$"
    replacement = "$1"
  }
}

loki.source.kubernetes "pod_logs" {
  targets    = discovery.relabel.pod_logs.output
  forward_to = [loki.process.pod_logs.receiver]
}

loki.process "pod_logs" {
  stage.static_labels {
      values = {
        cluster = "vicky-test",
      }
  }

  forward_to = [loki.write.default.receiver]
}

// k8s events
loki.source.kubernetes_events "cluster_events" {
  job_name   = "integrations/kubernetes/eventhandler"
  log_format = "logfmt"
  forward_to = [loki.process.cluster_events.receiver]
}

loki.process "cluster_events" {
  forward_to = [loki.write.default.receiver]

  stage.static_labels {
    values = {
      cluster = "vicky-test",
    }
  }

  stage.labels {
    values = {
      kubernetes_cluster_events = "job",
    }
  }
}

// for Traces - to Tempo
otelcol.receiver.otlp "otlp_receiver" {
  grpc {
    endpoint = "0.0.0.0:4317"
  }
  http {
    endpoint = "0.0.0.0:4318"
  }
  output {
    traces = [otelcol.exporter.otlphttp.tempo.input]
  }
}

otelcol.exporter.otlphttp "tempo" {
  client {
    endpoint = "http://tempo-distributor.tracing:4318"
    tls {
      insecure = true
      insecure_skip_verify = true
    }
  }
}
log 的部份,會去讀 /var/log/pods 下的檔案,然後再用其他的 rule 去做對應的處理,例如更換 label、新增一個 cluster: vicky-test 的 label。
最後,再根據 forward_to = [loki.write.default.receiver],去查 loki.write "default" 那一段的設定,寫到指定的 endpoint,也就是 http://loki-gateway.loki/loki/api/v1/push
另外,trace 的部份則是透過 otelcol.receiver.otlp "otlp_erceiver" 那一段,trace 由 alloy 的 4317 或 4318 port 進到 alloy,然後 output 寫到 otelcol.exporter.otlphttp.tempo 那一段指定的 endpoint,也就是 http://tempo-distributor.tracing:4318
最後,以 DaemonSet 的方式來部署 alloy 吧
helm install -n alloy --create-namespace alloy . -f values-alloy.yaml一樣,看查看一下部署之後的狀態
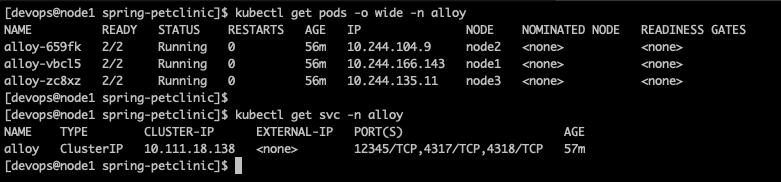
呼~到這裡總算完成了 server 端的設定了,只等測試的 application 把 log 跟 trace 傳送過來
3.5 部署 Java 測試 application - Spring PetClinic
這個部份,主要就是要把測試的 application compile 出來成 JAR file,會產出在 target/spring-petclinic-3.4.0-SNAPSHOT.jar(版本不同檔名可能不太一樣)
另外,要先下載 opentelemetry java agent
wget https://github.com/open-telemetry/opentelemetry-java-instrumentation/releases/latest/download/opentelemetry-javaagent.jar然後透過 Dockerfile 打包成 container image 並 push 至 contaienr registry 或在 worker node 上手動 load image
步驟不詳細寫了,我把 Dockerfile 留在下方
FROM eclipse-temurin:21-jdk-jammy

WORKDIR /app

COPY target/spring-petclinic-3.4.0-SNAPSHOT.jar spring-petclinic.jar
COPY opentelemetry-javaagent.jar opentelemetry-javaagent.jar

CMD ["sh", "-c", "java \
 -Dotel.service.name=${OTEL_SERVICE_NAME} \
 -Dotel.exporter.otlp.endpoint=${OTEL_EXPORTER_OTLP_ENDPOINT} \
 -Dotel.traces.exporter=${OTEL_TRACES_EXPORTER} \
 -Dotel.metrics.exporter=${OTEL_METRICS_EXPORTER} \
 -javaagent:./opentelemetry-javaagent.jar \
 -jar spring-petclinic.jar"]
以 helm create spring-petclinic 為 application 建立 helm chart,並修改相關的檔案
- values.yaml
這裡的 otlp.ServiceName 是稍後在 tempo 裡可以用來查詢用的 service name;而 otlp.endpoint 則是要把 trace 傳送到什麼地方
因為這個服務要給來自 K8S cluster 以外的 request 可以連接,service 開成 node port
# Default values for spring-petclinic.# This is a YAML-formatted file.# Declare variables to be passed into your templates.

replicaCount: 1

otlp:
  ServiceName: petclinic-direct
  endpoint: http://tempo-distributor.tracing:4318

image:
  repository: petclinic
  pullPolicy: IfNotPresent
# Overrides the image tag whose default is the chart appVersion.
  tag: "0.1"

imagePullSecrets: []
nameOverride: ""
fullnameOverride: ""

serviceAccount:
# Specifies whether a service account should be created
  create: true
# Automatically mount a ServiceAccount's API credentials?
  automount: true
# Annotations to add to the service account
  annotations: {}
# The name of the service account to use.# If not set and create is true, a name is generated using the fullname template
  name: ""

podAnnotations: {}
podLabels: {}

podSecurityContext: {}
# fsGroup: 2000

securityContext: {}
# capabilities:#   drop:#   - ALL# readOnlyRootFilesystem: true# runAsNonRoot: true# runAsUser: 1000

service:
  type: NodePort
  port: 8080

ingress:
  enabled: false
  className: ""
  annotations: {}
    # kubernetes.io/ingress.class: nginx
    # kubernetes.io/tls-acme: "true"
  hosts:
    - host: chart-example.local
      paths:
        - path: /
          pathType: ImplementationSpecific
  tls: []
#  - secretName: chart-example-tls#    hosts:#      - chart-example.local

resources: {}
# We usually recommend not to specify default resources and to leave this as a conscious# choice for the user. This also increases chances charts run on environments with little# resources, such as Minikube. If you do want to specify resources, uncomment the following# lines, adjust them as necessary, and remove the curly braces after 'resources:'.# limits:#   cpu: 100m#   memory: 128Mi# requests:#   cpu: 100m#   memory: 128Mi

autoscaling:
  enabled: false
  minReplicas: 1
  maxReplicas: 100
  targetCPUUtilizationPercentage: 80
# targetMemoryUtilizationPercentage: 80# Additional volumes on the output Deployment definition.
volumes: []
# - name: foo#   secret:#     secretName: mysecret#     optional: false# Additional volumeMounts on the output Deployment definition.
volumeMounts: []
# - name: foo#   mountPath: "/etc/foo"#   readOnly: true

nodeSelector: {}

tolerations: []

affinity: {}
- templates/deployment.yaml
這裡有加了幾個環境變數進去,像是 OTEL_SERVICE_NAME、OTEL_EXPORTER_OTLP_ENDPOINT .... etc
apiVersion: apps/v1
kind: Deployment
metadata:
  name: {{ include "spring-petclinic.fullname" . }}
  labels:
    {{- include "spring-petclinic.labels" . | nindent 4 }}
spec:
  {{- if not .Values.autoscaling.enabled }}
  replicas: {{ .Values.replicaCount }}
  {{- end }}
  selector:
    matchLabels:
      {{- include "spring-petclinic.selectorLabels" . | nindent 6 }}
  template:
    metadata:
      {{- with .Values.podAnnotations }}
      annotations:
        {{- toYaml . | nindent 8 }}
      {{- end }}
      labels:
        {{- include "spring-petclinic.labels" . | nindent 8 }}
	{{- with .Values.podLabels }}
        {{- toYaml . | nindent 8 }}
        {{- end }}
    spec:
      {{- with .Values.imagePullSecrets }}
      imagePullSecrets:
        {{- toYaml . | nindent 8 }}
      {{- end }}
      serviceAccountName: {{ include "spring-petclinic.serviceAccountName" . }}
      securityContext:
        {{- toYaml .Values.podSecurityContext | nindent 8 }}
      containers:
        - name: {{ .Chart.Name }}
          env:
            - name: OTEL_SERVICE_NAME
              value: "{{ .Values.otlp.ServiceName }}"
            - name: OTEL_EXPORTER_OTLP_ENDPOINT
              value: "{{ .Values.otlp.endpoint }}"
            - name: OTEL_TRACES_EXPORTER
              value: "otlp"
            - name: OTEL_METRICS_EXPORTER
              value: "none"
          securityContext:
            {{- toYaml .Values.securityContext | nindent 12 }}
          image: "{{ .Values.image.repository }}:{{ .Values.image.tag | default .Chart.AppVersion }}"
          imagePullPolicy: {{ .Values.image.pullPolicy }}
          ports:
            - name: http
              containerPort: {{ .Values.service.port }}
              protocol: TCP
          resources:
            {{- toYaml .Values.resources | nindent 12 }}
          {{- with .Values.volumeMounts }}
          volumeMounts:
            {{- toYaml . | nindent 12 }}
          {{- end }}
      {{- with .Values.volumes }}
      volumes:
        {{- toYaml . | nindent 8 }}
      {{- end }}
      {{- with .Values.nodeSelector }}
      nodeSelector:
        {{- toYaml . | nindent 8 }}
      {{- end }}
      {{- with .Values.affinity }}
      affinity:
        {{- toYaml . | nindent 8 }}
      {{- end }}
      {{- with .Values.tolerations }}
      tolerations:
        {{- toYaml . | nindent 8 }}
      {{- end }}
- templates/service.yaml
apiVersion: v1
kind: Service
metadata:
  name: {{ include "spring-petclinic.fullname" . }}
  labels:
    {{- include "spring-petclinic.labels" . | nindent 4 }}
spec:
  type: {{ .Values.service.type }}
  ports:
    - port: {{ .Values.service.port }}
      targetPort: 8080
      protocol: TCP
      name: http
  selector:
    {{- include "spring-petclinic.selectorLabels" . | nindent 4 }
這個都準備好了後,就可以下 helm install -n default petclinic . 來安裝這個 application
一樣,來看看安裝後的狀態。從下圖,可以看到 node port 是開在 port 30621
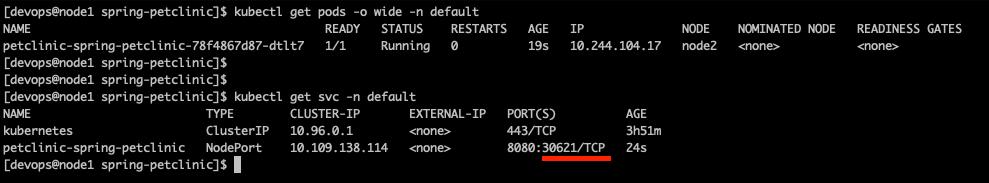
先連到首頁,能看到以下的網頁,即代表 application 有成功部署至 K8S cluster 上

4. 測試
application 部署成功後,就可以來進行測試了,這裡會進行以下幾個測試
4.1 application log -> loki
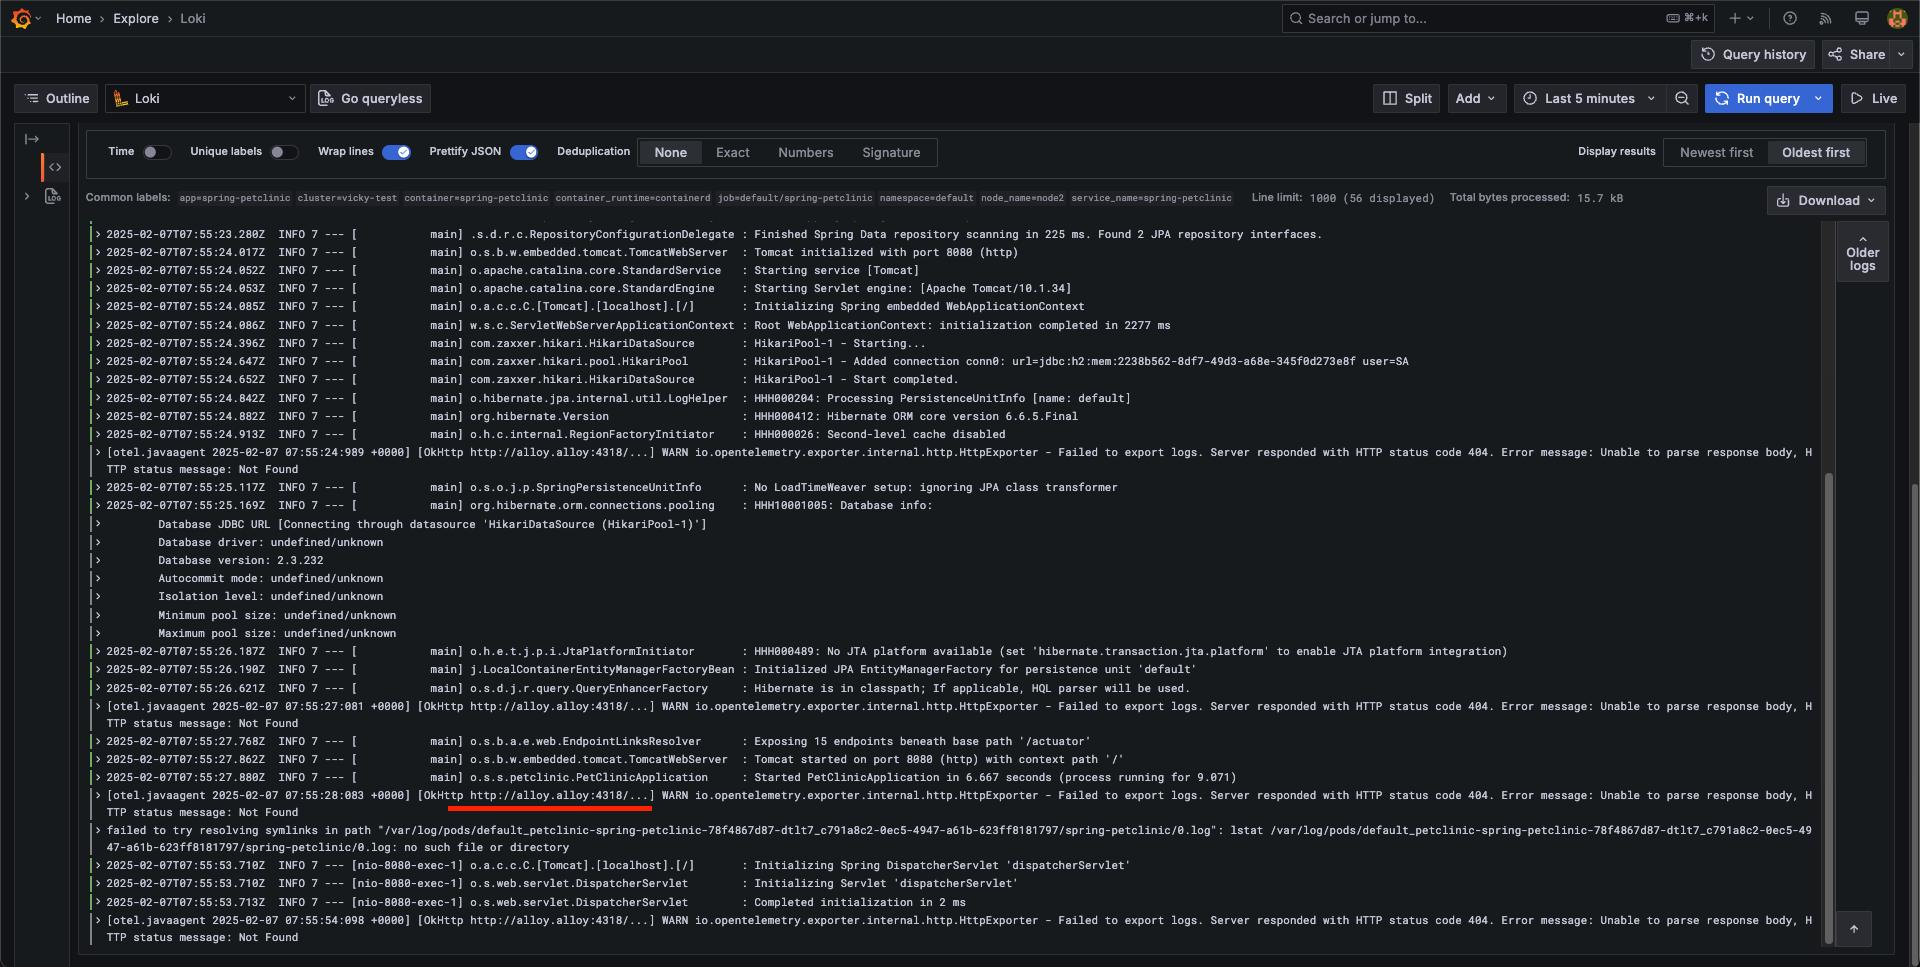
直接進到 grafana 頁面操作,explore -> loki,然後 label filter 設為 app = spring-petclinic
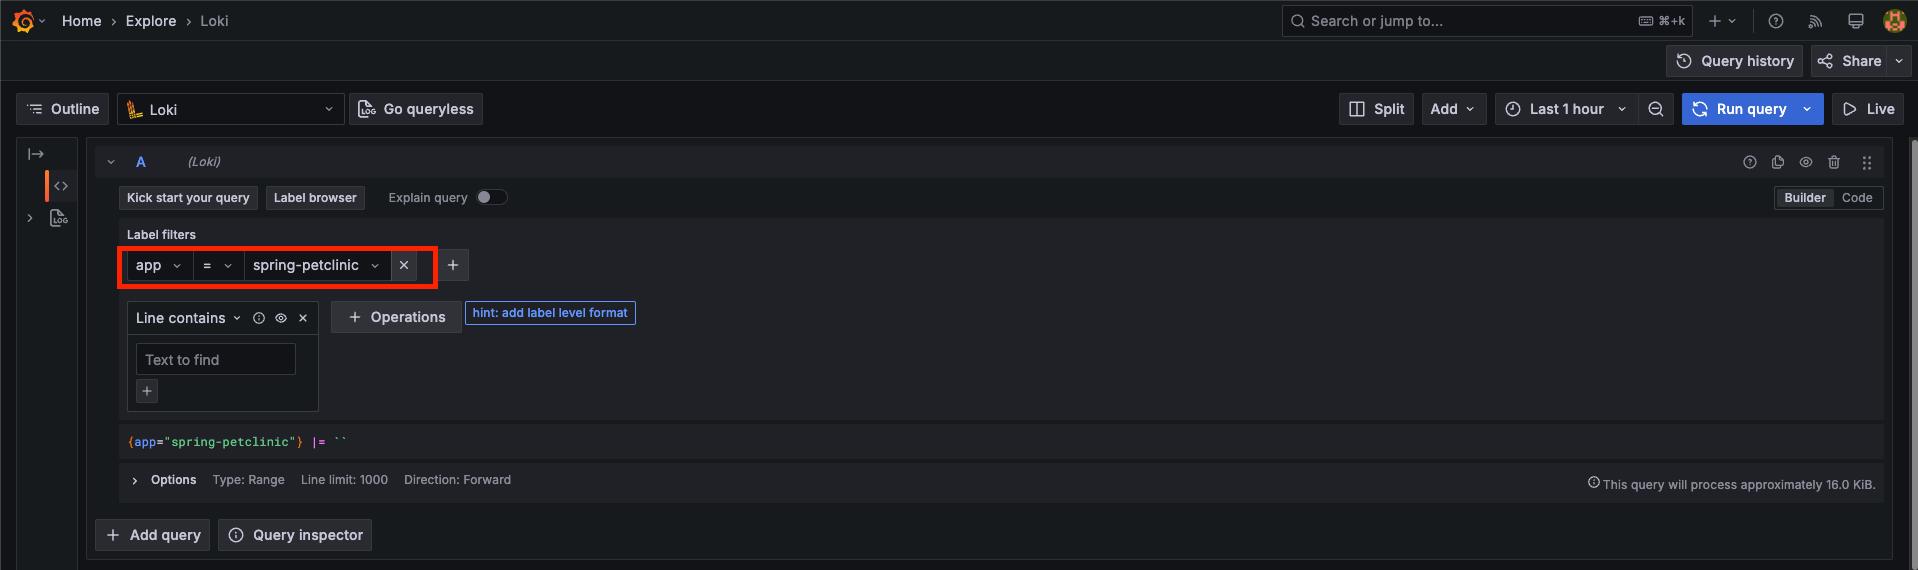
應該就要能看到如下的 log 了,可以看到 pod 啟動時的 log,也可以看到 trace 是直接接到 http://tempo-distributor.tracing:4318/
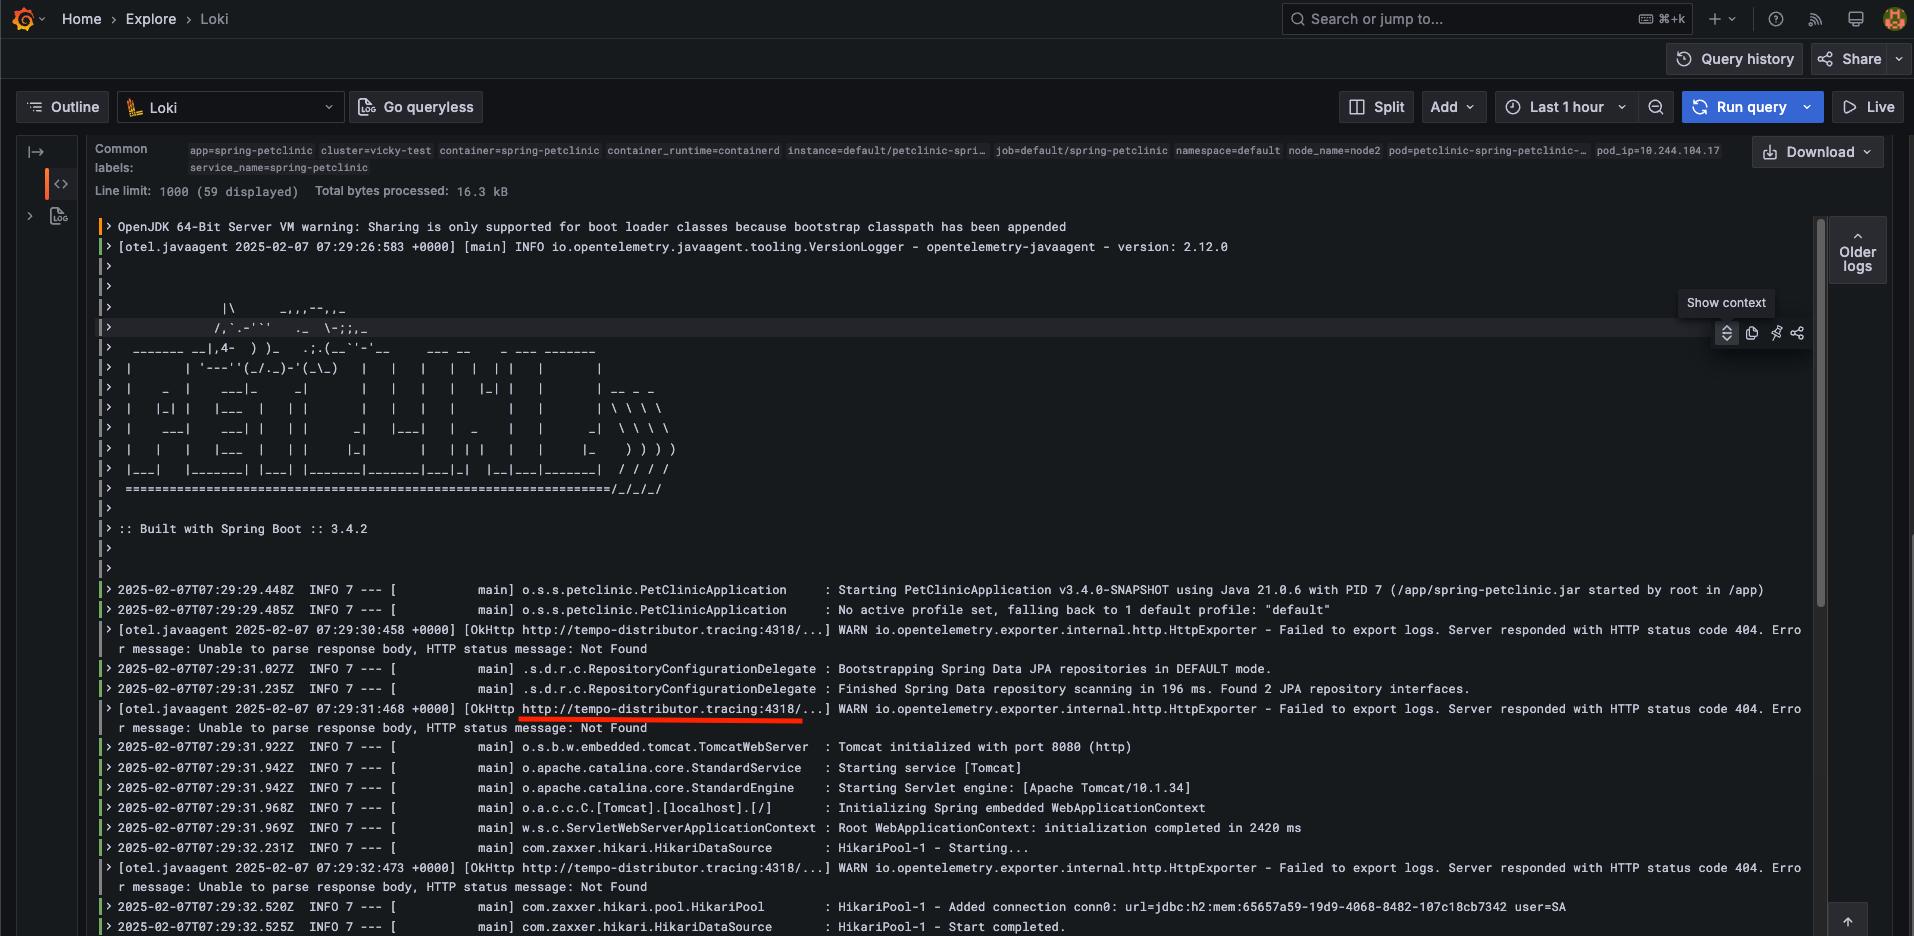
4.2 application trace -> 直接進 tempo
由 4.1 的 log,可以看得出來 trace 是直接由 application 接至 http://tempo-distributor.tracing:4318/
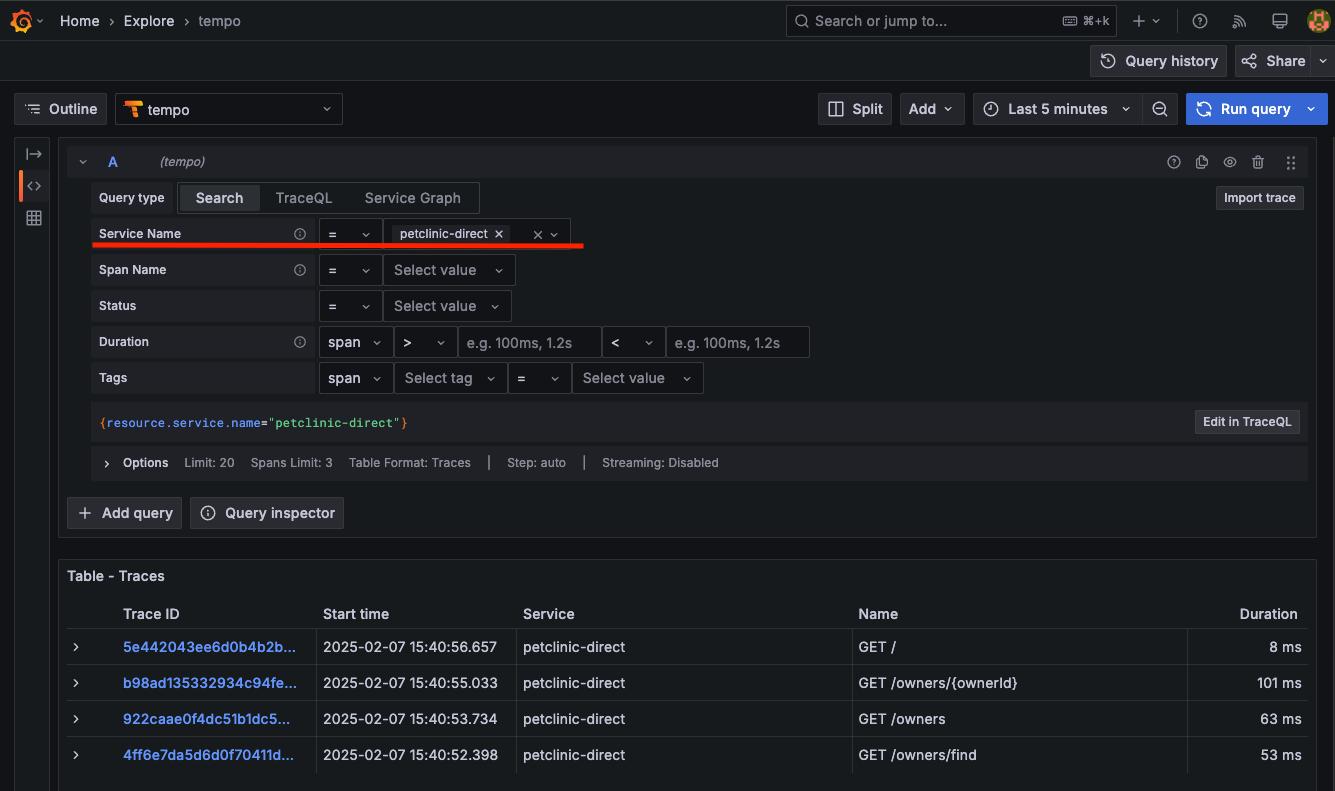
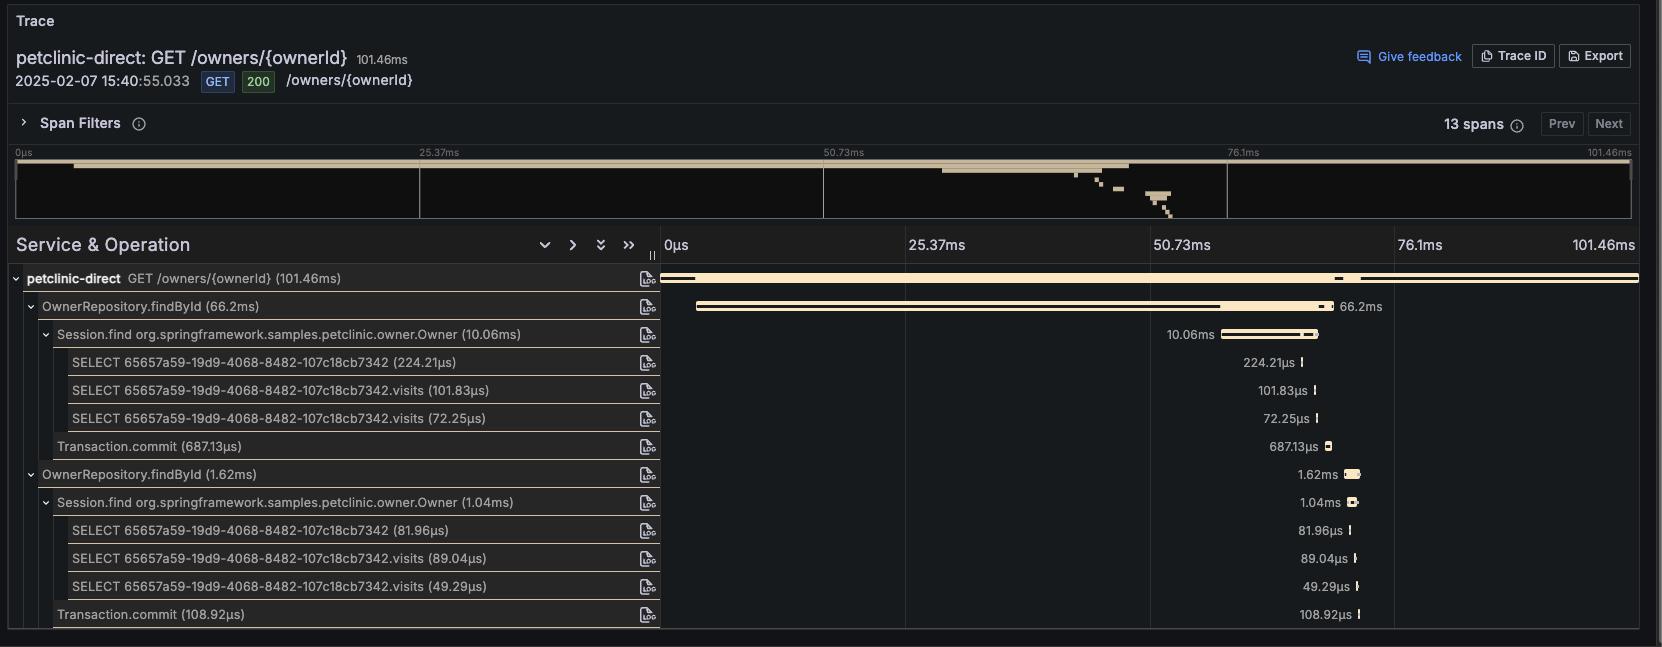
點一筆出來 trace 來看一下
就可以看得到類似像 Jaeger 查詢結果的畫面,很容易看得出來是哪一段最耗時
4.3 applcation trace -> 先到 alloy -> alloy 再轉至 tempo
在進行本次測試前,要先來修改一下 values.yaml 裡的值,把 otlp 那一個 block 的內容,改成如下
otlp:
  ServiceName: petclinic-alloy
  endpoint: http://alloy.alloy:4318
改好後,執行以下的指令讓設定生效
helm upgrade -n default petclinic .等到 pod 起來後,先來查看 log,application 正常啟動,但其中 trace 的部份,則是先送至 alloy,再由 alloy 轉至 tempo
從 log 裡就可以看到剛剛在 values.yaml 裡修改過的設定已經生效了
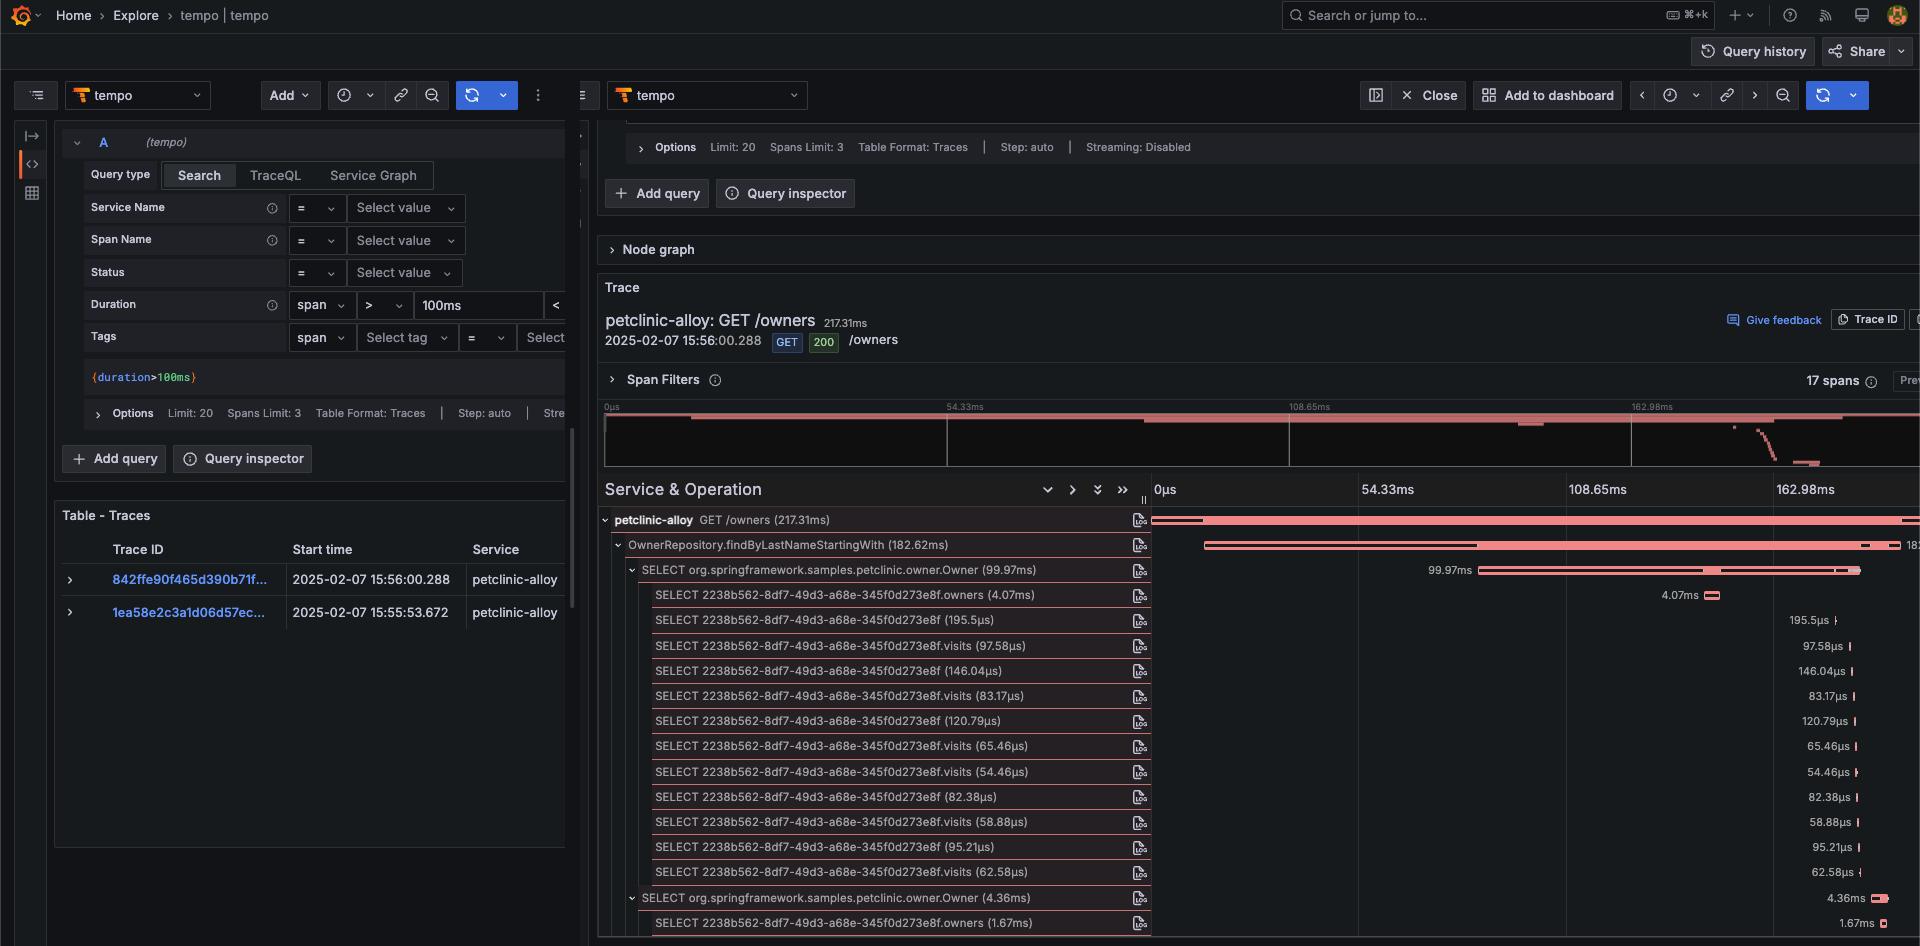
然後,連到 application 頁面,隨意做一些操作後,再來查看 trace
會看到 Service 的名稱已經變成 petclinic-alloy,也就是剛剛在 values.yaml 裡的設定,這個部份是用來做為辨別使用
能看到 trace 即表示 alloy 可以正確地把 trace 傳送至 tempo 了
5. 結論
Alloy 是 Grafana 陣營用來做為傳送 log, metrics 以及 trace 三合一的 agent,alloy 讓日常維運工作相對簡化,從以前要維護三種不同的 agent,變成只要維護一種即可。未來如果有別種後端的 solution,也可以很輕易透過更改 alloy 的設定,就轉送到其他的地方,而不用修改程式端的設定
不過,alloy 本身學習曲線有點高,一開始在文件的研讀上,得花上較多的時間才能理解設定檔要如何撰寫。也希望未來 Grafana 不管是在網站或是 helm chart 上,相關文件可以變得更容易上手啊。